Is Debt to GDP Ratio a good explanatory of country risk?

The Debt to GDP ratio is often taken as a measure to explain the risk rating associated with the Sovereign rating for that country. In this article we attempt to shed light on other explanatory variables for Sovereign ratings other than Debt to GDP ratio.
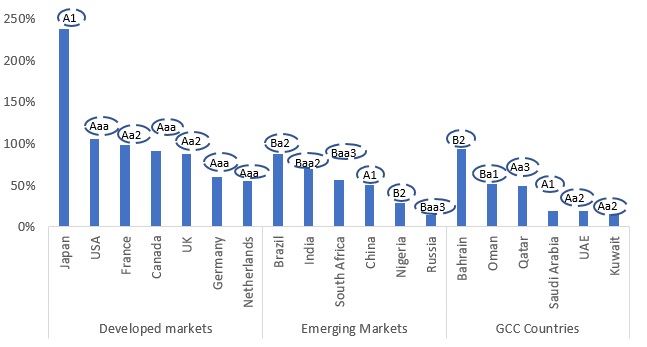
Debt to GDP ratio of a country is a very important variable that determines the country’s Sovereign risk rating as it reflects the Country’s ability to service its debt. However, for lower income countries the GDP generated may go towards meeting the essential expenses of living of the population, leaving little surplus for servicing debt. Therefore, in such countries the Debt to GDP ratio must be lower than that for well off countries who have a greater surplus after meeting essential expenditures. Therefore, sovereign rating for developed countries is higher though their Debt to GDP ratio is higher or comparable to that for less developed countries. As an illustration, developed countries like USA, Japan, France, and UK enjoy sovereign ratings between Aaa to A1 (as per Moody’s rating scale) which are several notches higher than ratings of Baa2 to Ba2 for lesser developed BRIC countries like South Africa, Brazil and India. This happens, though these developed countries have Debt to GDP ratios higher or equal to the ratios for these BRIC nations (The Debt to GDP Ratios for these developed countries are in the range of 70% to 237% which is equal to or higher than Debt to GDP ratio range of 56% to 88% for the mentioned BRIC countries).
Debt to GDP ratio and the respective Sovereign Ratings:

Source: Reuters, IIF
The Wealth to Debt ratio can be another factor that can go in explaining the higher sovereign rating though the Debt to GDP ratio is comparable. The first example is a comparison of rating of UAE at Aa2 which 2 notches is higher than that of Saudi Arabia (A1) though their Debt to GDP ratios are similar around 19%. This maybe because UAE enjoys a higher Wealth to GDP ratio of 8.8 compared to 6.5 for Saudi Arabia. Another example is the comparison between China and South Africa both of whom have Debt to GDP ratios of around 50.5-56.7%, but China has a rating of A1 which is 5 notches higher than rating of Baa3 for South Africa. One of the possible reasons for the rating difference can be wealth to debt ratio for China which is higher at 7.7 while that for South Africa is lower at 3.8.
Greater export revenues prospects and higher current account balance means less likely default by them in the eyes of external investors lending to that economy. This can be another factor that may explain higher rating though the Debt to GDP Ratio is higher on a comparative basis. An example for this case is the rating of Aa3 for Qatar which is 7 notches higher than that of Oman which has a rating of Ba1. Though Qatar and Oman both have a Debt to GDP ratio of 48.4% to 50.9%, Qatar has a current account balance of (+)9.3% while Oman has a negative current account balance of (-) 5.9%.
Lower inflation means stronger currencies leading to better and more certain debt servicing capabilities of countries. Therefore, this factor may be a cause for countries with different debt to gdp ratios but having differences in country risk ratings. For example, Kuwait and Russia are both having debt to GDP ratios that are similar around 14% but Kuwait has a rating of Aa2 which is 7 notches higher than the rating of Russia at Baa3. These two countries have different current account surpluses of 7.0% and 12.8%, but Kuwait has inflation of 0.7% which is lower than inflation of 2.8% for Russia which may explain rating differences between the two countries.
Asides from all the above, other factors exist like political risk, which is very low in developed countries like USA, Capital account surpluses balance current account deficits in some of these countries and cyclicality in economic performance etc. all of which can result in rating differences.
