Top 20 GCC Mutual Funds 2015
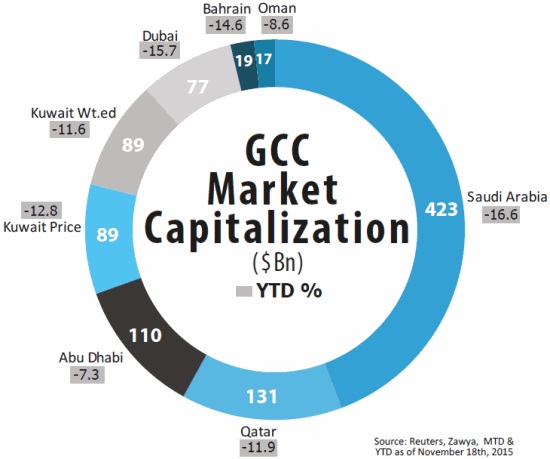
Market liquidity has fallen in 2015 to USD 464 bn (YTD – October 2015), due to the declining investor confidence in the GCC markets and low trading activity, after reaching a 5- year high of USD 771 bn in 2014 and 10-year high of USD 1,618 bn in 2006. Since June 2014, the fall in oil price continued to have a big impact on the markets and investor sentiments. Investors worry whether the decline in revenues is going to affect government spending, which in turn will affect the earning potential of the corporates. The Chinese sell off and struggling Eurozone markets have further exacerbated the negative sentiments. After a stellar 2014, which witnessed 14 new issues worth USD 9.7bn, including the listing of NCB, the largest IPO in the region, 2015 has turned out dull for companies seeking funding from public. Until October ’15, only 4 issues have been listed, worth a relatively paltry USD 1.2bn. Most companies are staying away from the volatile GCC markets, due to the down trending oil price and weak global markets.
In terms of valuation, P/E of Kuwait (14.2x) market was at premium among the GCC markets while the markets of Bahrain (8.7x), Oman (9.7x) and Dubai (10x) were the least priced markets. Saudi Arabia (1.7x) and Qatar (1.7x) continue to remain relatively overvalued in terms of P/B compared with Bahrain (0.9x) and Kuwait (1.1x). The valuation ratios for nearly all countries declined as the stock markets across the region decreased in value. Weak investor sentiments due to global equity and commodity markets slowing down after H2, 2014 coupled with prolonged low oil price was the main reason for decline in the valuation ratios.
GCC Mutual Funds Analysis:
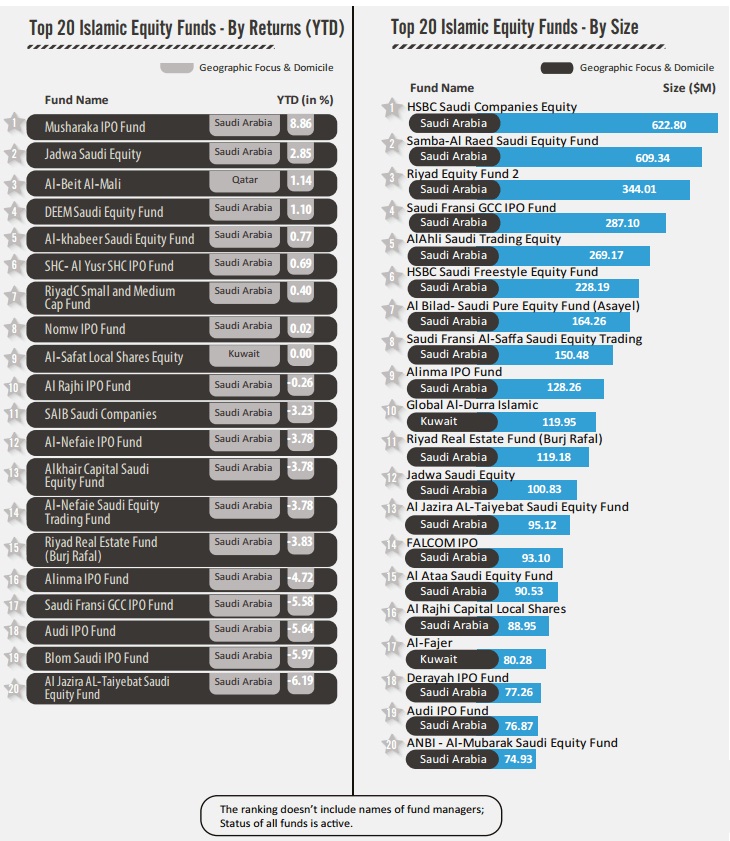
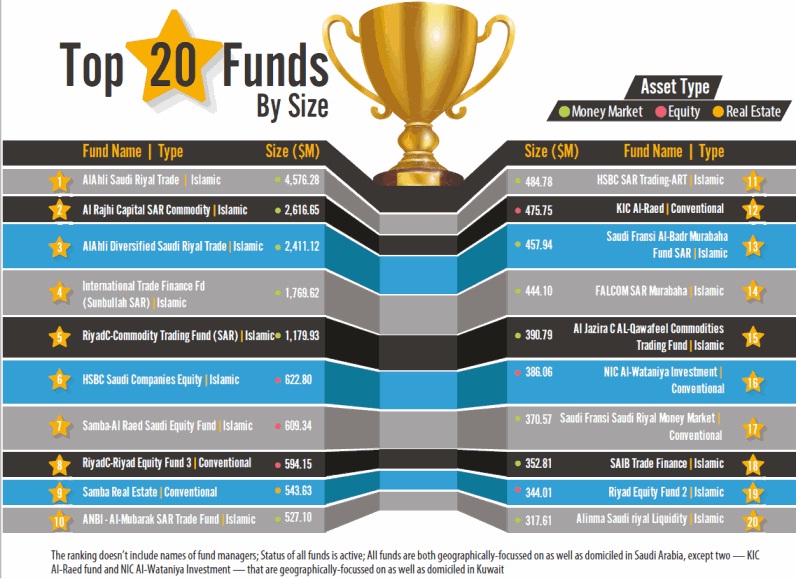
Based on Size: The GCC mutual fund industry comprises of 225 active mutual funds, out of which 135 were Islamic and the remaining 90 were conventional funds, with AuM of USD 29.84 Bn. Based on the size, the top 20 funds comprised 15 Islamic funds, the top 5 being Islamic money market funds. RiyadC- Riyad Equity Fund managed by Riyad Capital was the largest conventional equity fund with size of USD 594.15 Mn and Saudi Fransi Saudi Riyal Money Market fund from Saudi Fransi Capital was the largest conventional money market fund accounting for USD 370.57 Mn. Among the specialized conventional funds, Samba Real Estate fund of Samba Capital and Investment Management Company (USD 543.63 Mn) was the largest. The fund sizes of the Islamic funds in GCC were comparatively higher than the conventional funds. Among the Islamic funds, the HSBC Saudi Companies Equity fund was the largest equity fund with size USD 622.8 Mn. AlAhli Saudi Riyal Trade fund, which is a money market fund, managed by NCB Capital with size of USD 4,576.28 Mn was the largest fund in the GCC. ANB-Al MubarakDyiar Jeddah Real Estate fund (USD 183.91 Mn) managed by Arab National Bank topped the list in the specialized Islamic funds category.
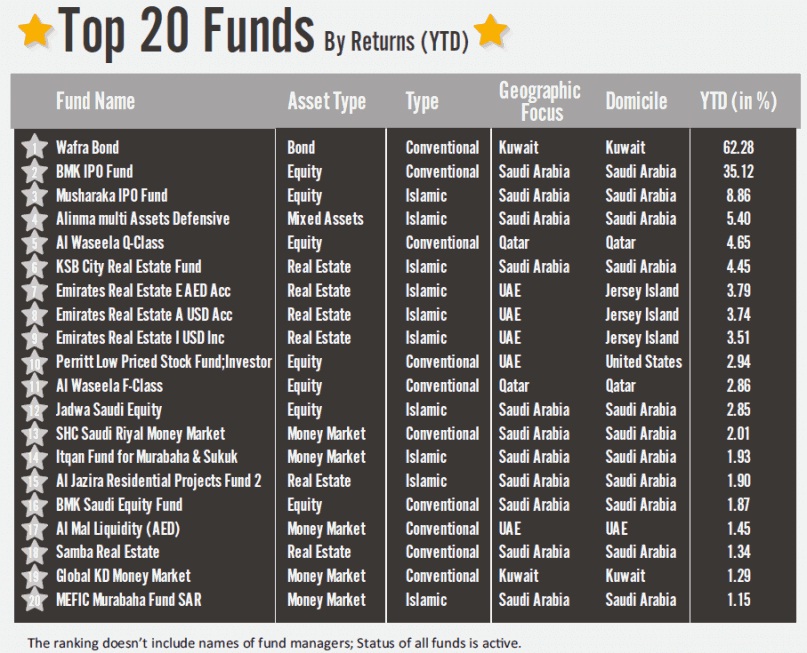
Based on Returns (YTD): The Wafra Bond market fund (conventional, specialized) and BMK IPO Fund (conventional, equity), generated returns of 62.28% and 35.12%, the top 2 in GCC. Wafra Bond fund’s returns increased due to a contract settlement in May 2015. Specialized funds have been the top performers in GCC when compared to equity and money market funds.
Among the conventional funds, BMK IPO Fund (equity) generated 35.12%, SHC Saudi Riyal Money Market generated 2.01% and Wafra Bond fund (specialized fund category) generated 62.28%, being the highest in their respective categories.
Among, Islamic funds, Musharaka IPO Fund in equity fund category registered a return of 8.86%, Itqan Fund for Murabaha & Sukuk generated 1.93% returns and Alinma multi Assets Defensive fund with 5.40% returns were the forerunners.
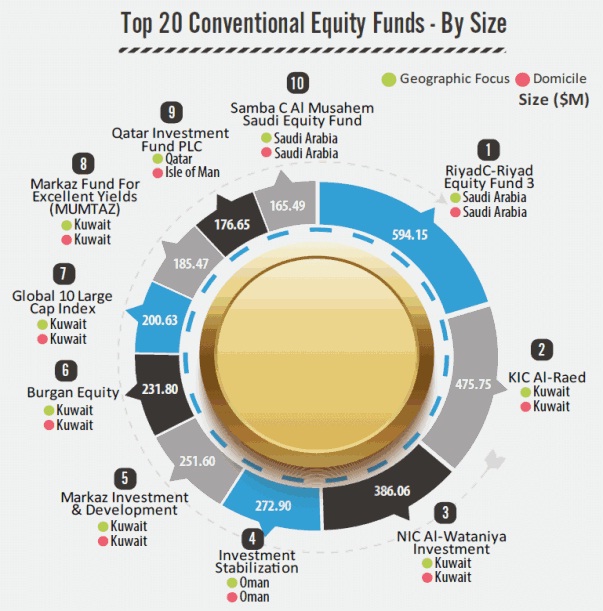
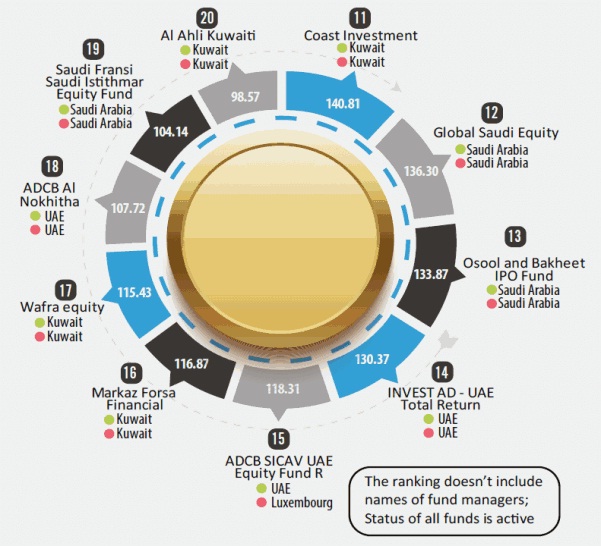
Methodology Followed for Ranking the Mutual Funds:
- Analysis includes those funds which has GCC region and its constituent countries as their geographic focus. These funds may/ may not be domiciled within GCC.
- Data such as asset size, returns and other relevant details for all funds was obtained from Zawya.
- The funds were categorized based on the product type – Conventional/ Islamic.
- Among the conventional and Islamic products, the funds were classified according to the asset type (equity, money market and specialized). All funds other than equity and money market funds such as real estate funds, index funds and bond funds were classified as specialized funds.
- The top 20 funds were arrived at under each category based on the asset size (AuM) and returns (Year-To- Date).
